KEcoLab/User Docs/Result: Difference between revisions
Page is created |
Content uploaded |
||
| Line 1: | Line 1: | ||
<h1>Introduction</h1> | <h1>Introduction</h1> | ||
The reports for your software’s measurement will be automatically generated using pre-defined R scripts. These scripts are written in order to evaluate the software’s sustainability under different conditions and operation modes. Let’s look at how you can download and get insights from the reports it generates. | |||
<h1> Download the Result</h1> | |||
As a result of the pipeline, you will be able to download the artifacts and reports from the merge request page you created. If you navigate to this section, you will find the '''Download artifacts''' folder. | |||
<h1> Structure of Artifacts folder </h1> | |||
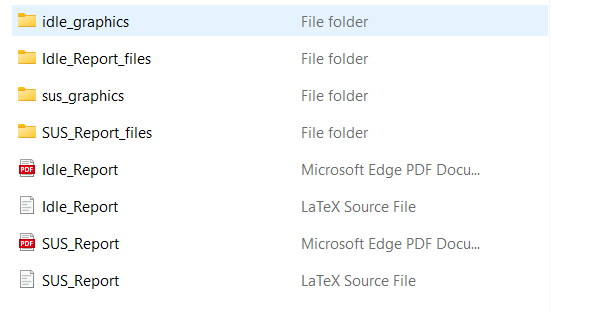
The results and artifacts used in the report will be downloaded as a zip folder. To access this, you have to unzip the folder using any tools, such as 7zip. The structure of the artifacts folder consists of SUS_report and Idle_report, and the idle_graphics, sus_graphics, Idle_Report_Files, and SUS_Report_Files folders contain graphics used on these reports. | |||
[[File:Kecolab-artifact-folder.png|center]] | |||
<h1> Idle_Report </h1> | |||
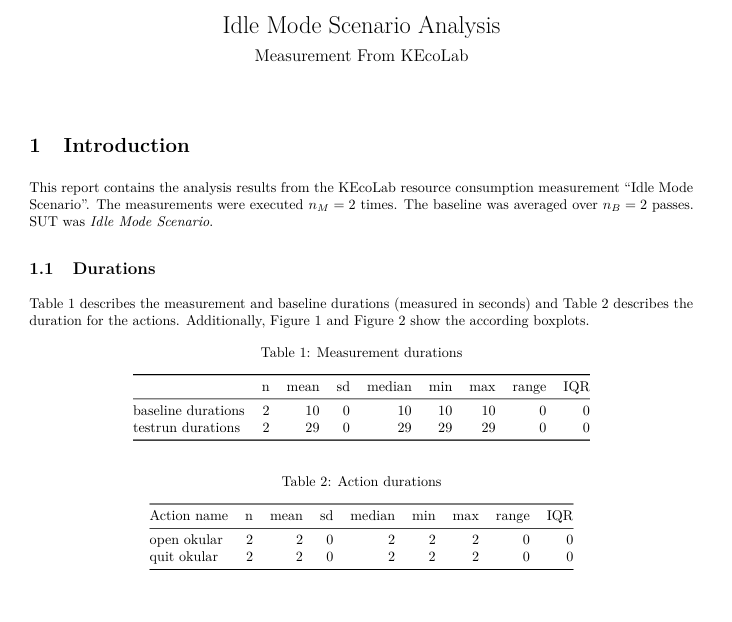
The Idle_Report starts with an introduction of the details about the measurement process (number of times and time taken) and how the Idle mode duration differs from baseline duration by plotting against a boxplot. | |||
[[File:Kecolab-idle-report-intro.png|center]] | |||
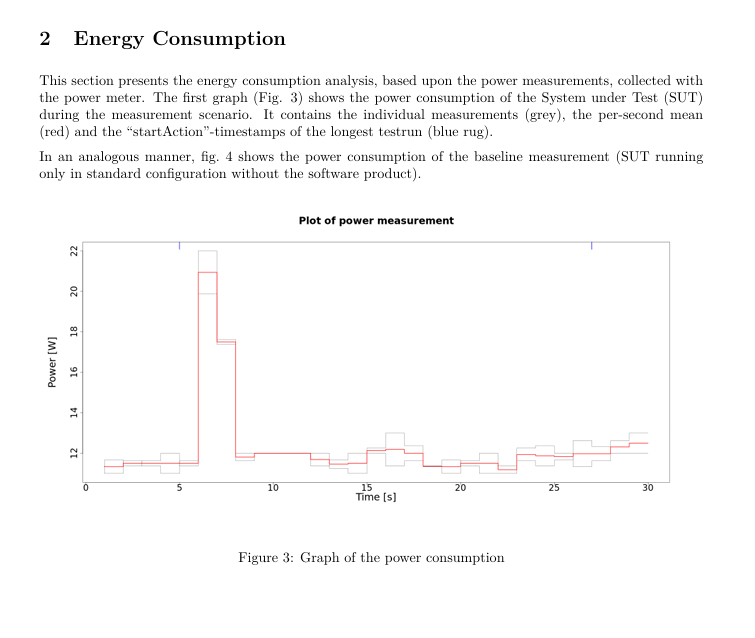
The next section, '''Energy Measurement''' starts with a graph of power measurement(Power Vs Time) that shows the power consumption of the System Under Test (SUT) during idle and baseline mode. Following by, this section provides a detailed explanation on the power and energy consumption of the system, per action, its accuracies, and how it differs from baseline. | |||
[[File:Kecolab-idle-report-energy.png|center]] | |||
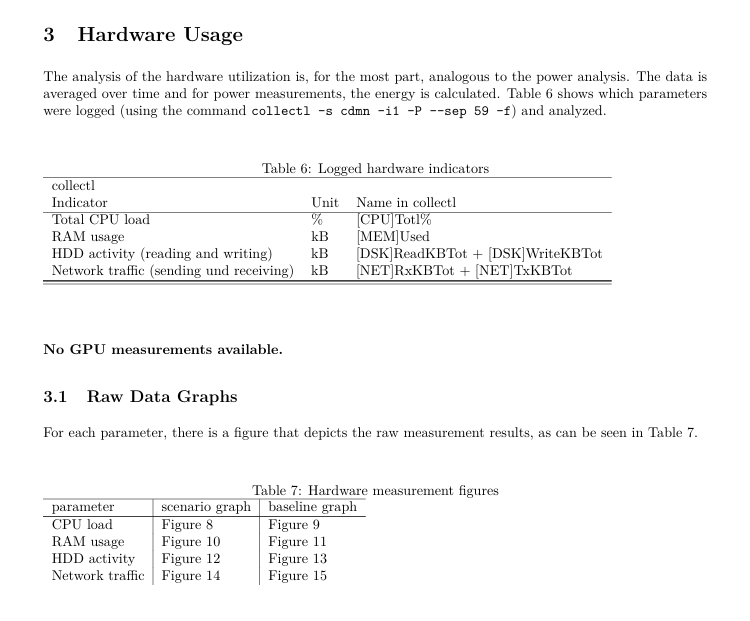
The last section, '''Hardware Usage'''provides a detailed report on GPU measurements, CPU load, RAM usage, and other hardware resource usages with graphs relevant to them. This section also compares the hardware usage of idle mode with the baseline mode of the system to differentiate the usages. The report ends with a result of showcasing the usages of hardware for software actions such as open and close. | |||
[[File:Kecolab-idle-report-hardware.png|center]] | |||
<h1> SUS_Report </h1> | |||
Similar to Idle_Report, SUS_Report has three sections: '''Introduction, Energy Measurement, and Hardware Usage'''. All the section structure is similar to Idle_Report except, SUS_Report focuses more on software actions apart from opening and closing the software. It focuses on every possible action you can perform in the system and measures energy consumption, hardware usage for every action, and how it differs from the baseline mode of the system. | |||
[[File:Kecolab-sus-report.png|center]] | |||
Compared to Idle_Report, SUS_Report is a very detailed report explaining energy measurement, power consumption, and hardware usage (GPU, CPU load, HDD) of every action performed during the measurement process. | |||
<h1> Conclusion </h1> | |||
By running the CI/CD pipeline iterations for 30 times, you can get detailed reports on various system actions' measurements (energy measurement, power consumption, and hardware usage) accurately. | |||
Latest revision as of 12:04, 1 April 2025
Introduction
The reports for your software’s measurement will be automatically generated using pre-defined R scripts. These scripts are written in order to evaluate the software’s sustainability under different conditions and operation modes. Let’s look at how you can download and get insights from the reports it generates.
Download the Result
As a result of the pipeline, you will be able to download the artifacts and reports from the merge request page you created. If you navigate to this section, you will find the Download artifacts folder.
Structure of Artifacts folder
The results and artifacts used in the report will be downloaded as a zip folder. To access this, you have to unzip the folder using any tools, such as 7zip. The structure of the artifacts folder consists of SUS_report and Idle_report, and the idle_graphics, sus_graphics, Idle_Report_Files, and SUS_Report_Files folders contain graphics used on these reports.
Idle_Report
The Idle_Report starts with an introduction of the details about the measurement process (number of times and time taken) and how the Idle mode duration differs from baseline duration by plotting against a boxplot.
The next section, Energy Measurement starts with a graph of power measurement(Power Vs Time) that shows the power consumption of the System Under Test (SUT) during idle and baseline mode. Following by, this section provides a detailed explanation on the power and energy consumption of the system, per action, its accuracies, and how it differs from baseline.
The last section, Hardware Usageprovides a detailed report on GPU measurements, CPU load, RAM usage, and other hardware resource usages with graphs relevant to them. This section also compares the hardware usage of idle mode with the baseline mode of the system to differentiate the usages. The report ends with a result of showcasing the usages of hardware for software actions such as open and close.
SUS_Report
Similar to Idle_Report, SUS_Report has three sections: Introduction, Energy Measurement, and Hardware Usage. All the section structure is similar to Idle_Report except, SUS_Report focuses more on software actions apart from opening and closing the software. It focuses on every possible action you can perform in the system and measures energy consumption, hardware usage for every action, and how it differs from the baseline mode of the system.
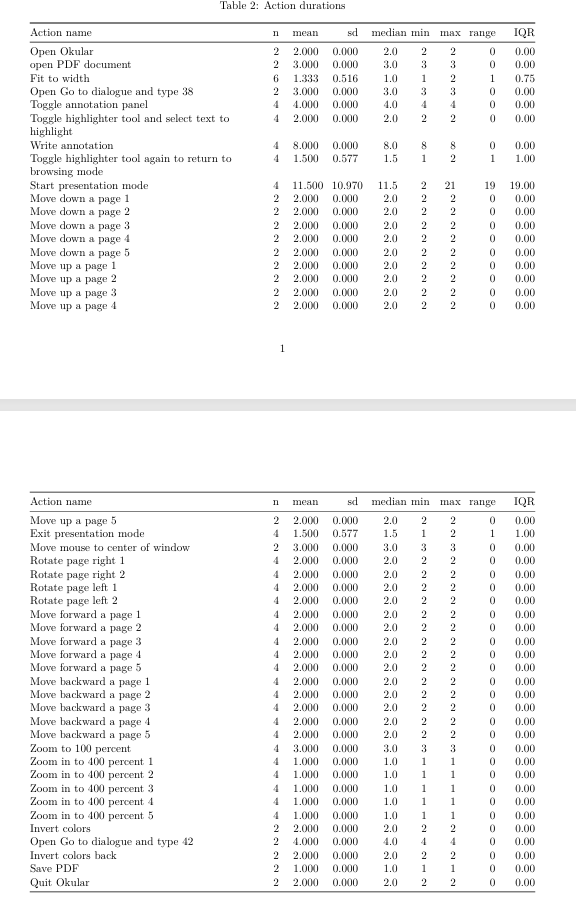
Compared to Idle_Report, SUS_Report is a very detailed report explaining energy measurement, power consumption, and hardware usage (GPU, CPU load, HDD) of every action performed during the measurement process.
Conclusion
By running the CI/CD pipeline iterations for 30 times, you can get detailed reports on various system actions' measurements (energy measurement, power consumption, and hardware usage) accurately.
